For a long time I was looking to run Python code together with my Oracle APEX application. Just for a PoC. As far as I know offers the MLE from Oracle only JavaScript at the moment. But a few days ago a saw a post from Stanley writing about „PyScript„.
On a high level, „PyScript“ brings Python to the Browser, to use a lot of existing modules in your own web applications. For more details go to the „PyScript“ page.
I will not go into detail how to implement „PyScript“ in your web applications. The post from Stanley is a good start for doing this. But I will show how to implement „PyScript“ in an APEX application and to show a matplotlib chart.
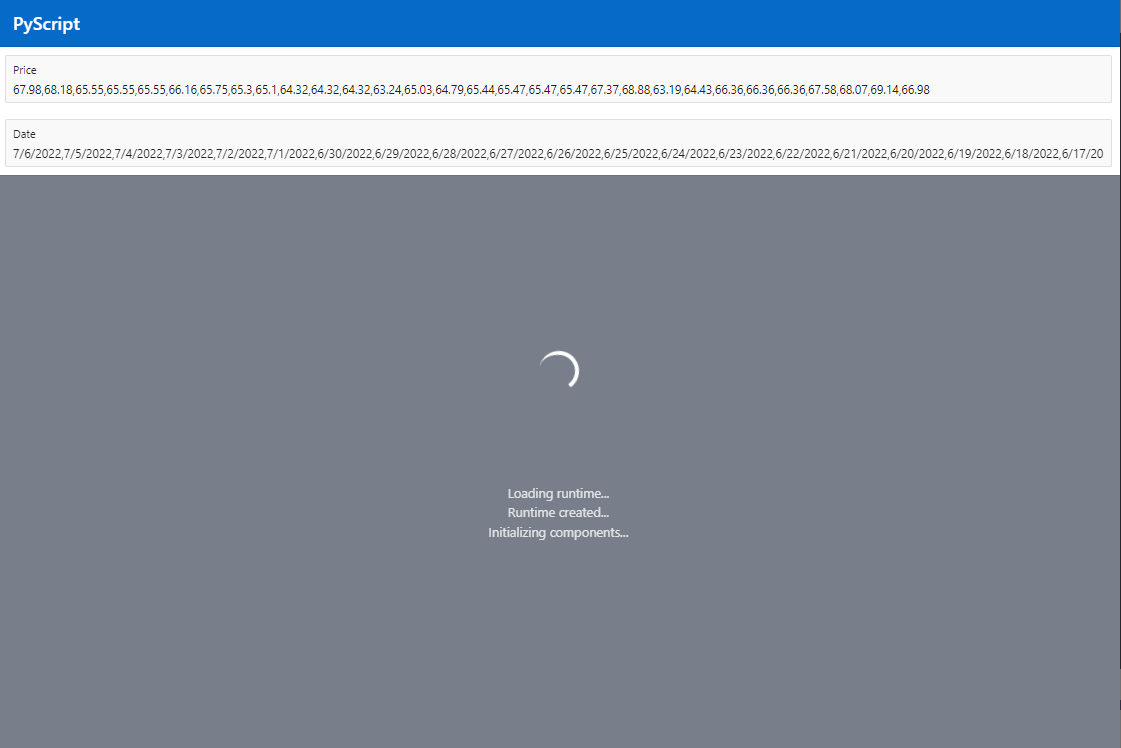
For that I created a small APEX application with only one page to present the result. You will see 2 page items (P1_PRICE, P1_DATE) holding the price and date values. This page items are filled via SQL Query on page load. The Python code read the value of this items via DOM and transfer it in NumPy arrays to plot the chart.
First, we have to load the pyscript.js via „File URLs“ in the JavaScript section on the page:
https://pyscript.net/alpha/pyscript.jsAs a second step on the page we have to load the pyscript.css via „File URLs“ in the CSS section:
https://pyscript.net/alpha/pyscript.cssThere are different ways to implement the Python code in the page. A clean way would an external .py file loaded via Static Application Files in the Shared Components. But for my PoC and because of a lot of re-writing/testing the code in the beginning I put it directly in the „HTML Code“ in the Source section:
<py-env>
- numpy
- matplotlib
</py-env>
<py-script>
import numpy as np
import matplotlib.pyplot as plt
# get Page Item P1_PRICE
ul_element = Element("P1_PRICE")
# transfer value from Page Item to numpy array
arr_price = np.fromstring(ul_element.value, dtype=float, sep=',')
# get Page Item P1_Date
ul_date = Element("P1_DATE")
# get Page Item value
date_list = ul_date.value
# transfer value from Page Item to array
arr_date = date_list.split(",")
# prepare the plot
fig, ax = plt.subplots(figsize=(15, 8))
# add the arrays to the plot
ax.plot(arr_date, arr_price)
# format the plot
fig.autofmt_xdate()
# display the plot
plt
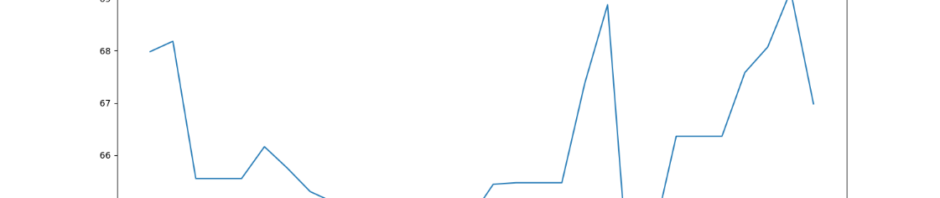
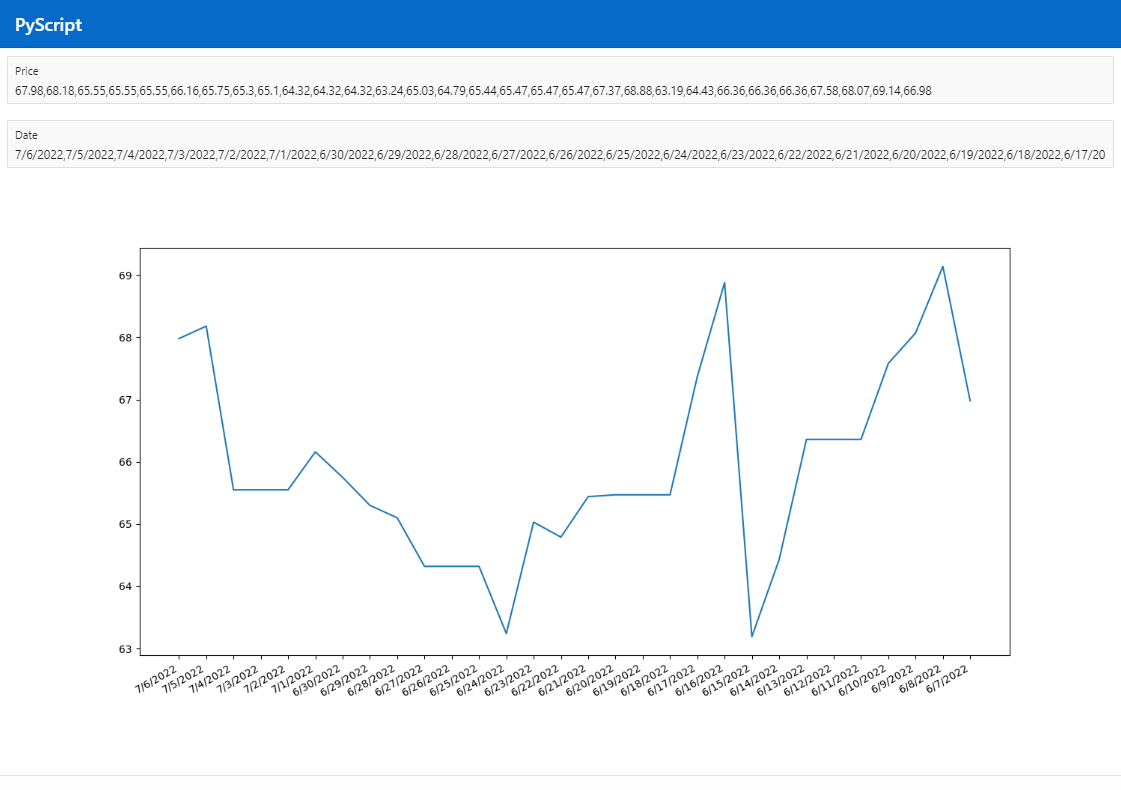
</py-script>After running the page it takes a few seconds to load the „PyScript“ environment and as a result, Python is rendering a line chart of data from the Oracle database via APEX.
The import of „PyScript“ offers an APEX application the Python world with a lot of modules to work with data and other usefull things. At the time of writing, PyScript is in an alpha state and is actively being developed, so breaking changes and newer features are to be expected since it hasn’t been stably released yet. And to be honest loading/showing a chart via APEX is much faster then via the Python code, because of starting the whole „PyScript“ backend with each page load.